Guidelines on Research
Updated on 21 May, 2026
RESEARCH METHODOLOGY
RESEARCH METHODOLOGY

The Research methodology chapter should normally be broken down sequentially into at least the following sections:
- Research Philosophy
- Research Approach
- Research Design
- Research Strategy
- Reliability, Validity and Generalisability
- Data Analysis
- Ethical Considerations
RESEARCH PHILOSOPHY
Set out your research paradigm, depending on the philosophy that underpins your research. The philosophical approach sets a framework of the study which provides the right answers to the research questions. According to Saunders et al. (2023), research philosophy is about development of knowledge in a particular field of study. As per the research onion (see Figure 1) by Saunders et al. (2023), there are four different approaches of research philosophy that are namely: positivism, realism, interpretivism and pragmatism, which are elaborated below.
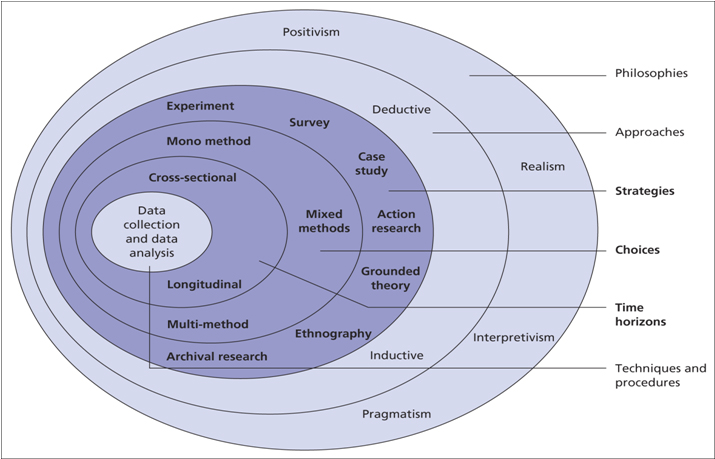
Figure 1: Research Onion (Source: Saunders et al., 2023, p.131)
Each philosophy is suitable for a different sort of study, and each involves different assumptions about the world (ontology), how we know that world (epistemology) and the nature of knowledge. The following table sums up key details about each philosophy, and should help you decide which is most useful for your area of study.
Positivism
The positivism approach is mainly based on facts rather than impressions which reflect the notion of social reality. The research is conducted in a value-free way. Positivism is also about formulating a research strategy for data collection and use existing theories to develop hypotheses. It has firmly been claimed that it is completely possible to adopt the key characteristics of the positivism in a research (Saunders et al., 2023).
If your research reflects the philosophy of positivism, then you will probably adopt the philosophical stance of the natural scientist. You will prefer collecting data about an observable reality, and search for regularities and causal relationships in your data to create law-like generalisations like those produced by scientists (Bell et al., 2022).
Realism
This philosophy relates mainly to scientific enquiries. It's about debating on whether objects exist independently of our knowledge to their existence. The essence is about projecting the reality as truth, independent of the human mind. This approach is purely based on existence of the mind and existence of its content only. Realism is further explained through direct and critical realism. The former states that you see what you get, while the latter argues that what we experience are mainly sensations in the real world which is far from being the actual direct things.
Realism is a branch of epistemology, which is similar to positivism in that it assumes a scientific approach to the development of knowledge. This assumption underpins the collection of data and the understanding of those data. The meaning becomes when these two forms of realism are contrasted (Saunders et al., 2023).
Interpretivism
Interpretivism is about understanding differences between human as social factors. Emphasis is being made on differentiating research among people to that of objects. Interpretivism can be further explained through phenomenology and symbolic interactionism. The former refers to the way humans make sense of the world while the latter is a continual process of interpreting the social world around us.
Crucial to the interpretivist philosophy is that the researcher has to adopt an empathetic stance. The challenge is to enter the social world of research subjects and understand their world from their point of view (Saunders et al., 2023).
Pragmatism
If it is about adopting your views to a position, then pragmatism is the philosophy to be adopted. This philosophy is about adopting one position which is somewhat unrealistic in practice. This approach avoids the debates on reality or truth but rather to what the researcher perceives of what is of interests or value based on a personal value system.
For pragmatists, the importance of the meaning of an idea are its practical consequences. They recognise that there are many different ways of interpreting the world and undertaking research, that no single point of view can ever give the entire picture and that there may be multiple realities (Saunders et al., 2023).
| Pragmatism | Positivism | Realism | Interpretivism | |
|---|---|---|---|---|
| Ontology: the researcher's view of the nature of reality or being | External, multiple, were chosen to best enable answering of research question | External, objective and independent of social actors | Is objective. Exists independently of human thoughts and beliefs or knowledge of their existence (realist), but is interpreted thorugh social conditioning (critical realist) | Socially constructed, subjective, may change, multiple |
| Epistemology: the researcher's view regarding what constitutes acceptable knowledge | Either or both observable phenomena and subjective meanings can provide acceptable knowledge dependent upon the research question. Focus on practical applied research, integrating different perspectives to help interpret the data | Only observable phenomena can provide credible data, facts. Focus on causality and law-like generalisations, reducing phenomena to simplest elements | Observable phenomena provide credible data, facts. Insufficient data means inaccuracies in sensations (direct realism). Alternatively, phenomena create sensations which are open to misinterpretation (critical realism). Focus on explaining within a context or contexts | Subjective meanings and social phenomena. Focus upon the details of the situation, a reality behind these details, subjective meanings motivating actions |
| Axiology: the researcher's view of the role of values in research | Values play a large role in interpreting results, the researcher adopting both objective and subjective points of view | Research is undertaken in a value-free way, the researcher is independent of the data and maintains an objective stance | Research is value laden, the researcher is biased by world views, cultural experiences and upbringing. These will impact on the research | Research is value bound, the researcher is part of what is being researched, cannot be separated and so will be subjective |
| Data collection techniques most often used | Mixed or multiple method designs, quantitative and qualitative | Highly structured, large samples, measurement, quantitative, but can use qualitative | Methods chosen must fit the subject matter, quantitative or qualitative | Small samples, in-depth investigations, qualitative |
Table 1: Research Philosophies (Source: Saunders et al., 2023, p.140)
RESEARCH APPROACH
You will need to explain the context of your research, its limitations, as well as answer the questions How, Why, What Where and When? It is in this section that you will explain and justify your decision regarding the use of qualitative, quantitative or mixed methods. Remember that each method is associated with a different approach to gathering data.
As an example, you first need to decide whether you are going to work along broadly positivist, scientific lines, starting with one or more defined hypotheses and testing them against reality. If so, you are likely to be collecting numerical data in reasonably large quantities (I'd say a sample size of 100 or more) and running statistical tests on this data. In other words, you'll be using a quantitative approach (related to collecting and manipulating data).
On the other hand, you might be more interested in exploring broad areas, probably to do with people's experiences of, perceptions of or emotional reactions to a subject, and looking in detail at these responses in all their richness. By looking at broad areas of interest, you are aiming to generate theories about the area you are investigating. If this is the case, you will be adopting a qualitative approach (related to the analysis of textual responses in detail).
Lastly, you might want to use a mixture of both of the abovementioned methods, i.e., mixed methods research, which is becoming increasingly popular. It's particularly useful when you want to reflect different perspectives on a subject, or put quantitative information into a robust real-world context.
RESEARCH DESIGN
Research design provides an overall guidance for the collection and analysis of data. It is a blueprint that enables researchers to find answers to the research questions in a study. A research can be classified as explanatory, exploratory or descriptive in nature (Saunders et al., 2023).
Explanatory (causal) research
Explanatory research is also known as causal research, and is conducted for answering the how and why questions. According to Saunders et al. (2023), emphasis is made on studying a situation or a problem in order to explain the relationship between variables. In general, this concept makes use of quantitative ways of research to describe relationships expressing the cause and effect of particular incident. However, explanatory research design also allows the use of a qualitative approach to answer the questions how and why, depending on the sources of the relationship between cause and effect.
Exploratory research
Exploratory research is undertaken to explore an area where little is known or to investigate the possibilities of undertaking a particular research study. This type of research is particularly useful when nature of the problem is unsure. As per Saunders et al. (2023), this concept is characterised as flexible and adaptable to daily changes as result of new information upcoming or new hypotheses appearing. Exploratory research design is the most suitable and useful for new studies giving significant contribution to understanding the findings of the main subject.
Descriptive research
According to Saunders et al. (2023), a descriptive approach is conducted with an attempt to portray an accurate profile of a situation. This may be an extension to a piece of exploratory research and/or explanatory research. The concept is useful and crucial when the researcher's achievement focuses on details and description of phenomena or when it should show prediction about specific findings.
RESEARCH STRATEGY
The need to have a clear research strategy is very important for any research under study, which can be categorised as positivist or phenomenological. Research strategies can be used for exploratory, descriptive and explanatory research. There are different types of research strategies among the commonly used are namely: experiment, survey, case study, action research, grounded theory, ethnography and archival research (Saunders et al., 2023).
In this section, you will therefore have to outline how you collected your data and explain your choice for using the methods you did, i.e., survey, interview. focus group discussion and so on.
The following important aspects must be covered:
- Identification and definition of your target population (from a reliable and referenced source)
- Sampling strategy, including your sampling technique(s), justification of your sample size, choice of demographic variables, method of data-collection
- Choice of questions in terms of their contribution towards answering your research questions and relevance to how they helped test the research hypotheses that formed the basis of your research
- Pilot testing (if you have designed a survey questionnaire) in order to confirm the face and content validity, as well as the internal consistency (reliability) of your measuring instrument
NOTE
It is recommended that you write the above at the start of your research, so that it can be changed if your methods are not producing the results you need. However, since dissertations are rather written in hindsight, you will have to be honest about the flaws and limitations in your research design. When writing or planning this section, it's good practice to refer back to your research questions, aims and objectives, and ask yourself whether what you are planning to do is the best way to answer the questions and achieve these objectives. It's always better to do this at an early stage, rather than look at the data you collected and eventually find that it doesn't throw any light on the topic you wanted to investigate.
For calculation of sample sizes, you may use the following online calculator:
Fisher (2023)
RELIABILITY, VALIDITY AND SAMPLE ADEQUACY
Reliability
According to Wiener et al. (2017), the reliability of a measure is the degree to which a measurement technique can be depended upon to secure consistent results upon repeated application. Reliability also measures the internal consistency of a measuring instrument by the amount of intercorrelation between a set of items. When there are statements measured on the Likert scale in a survey questionnaire, the Cronbach alpha coefficient is the most appropriate measure of internal consistency (Laerd Statistics, 2018).
Despite the fact that there is no distinct cut-off point for a reliability coefficient, a Cronbach Alpha value of at least 0.7 is acceptable as a proof of reliability (Bujang et al., 2018). In some cases, we may even accept values as low as 0.6 (Malhotra, 2019). Moreover, it was further limited at its upper end by Nawi et al. (2020) and Dabbagh et al. (2023), who argued that a coefficient exceeding 0.95 might mean that some items in the measuring instrument are redundant.
Validity
Validity determines whether an instrument measures what it is supposed to measure (Wiener et al., 2017). During the piloting stage of the questionnaire, the face and content validity are normally verified by respondents' feedback.
A more scientific and objective way of validating a measuring instrument is via construct validity which, determines whether the data contains underlying constructs, i.e., exhibits dimensionality (Solimun and Fernandes, 2017). One way of verifying construct validity is by way of factor validity (Tavakol and Wetzel, 2020; Dabbagh et al., 2023), which consists of subjecting the data to factor analysis and then observing the results for Bartlett's test of Sphericity. The instrument, and hence the data, is deemed to be valid if the Sig. value (or p-value) obtained does not exceed 0.05 (Field, 2024), the usual default level of significance.
Sample Adequacy
In SPSS, the KMO test is performed simultaneously during factor analysis and its result is given in the same output as that for construct validity testing. The presence of dimensionality is confirmed if the Kaiser-Meyer-Olkin (KMO) sample adequacy test yields a value that is greater than 0.5 (Field, 2024).
DATA ANALYSIS
Specify and justify the use of the techniques and tests that you intend to analyse your data with. For example, if you have sampled texts, or have a lot of qualitative data, will you be using semiotics analysis, discourse analysis and so on? You may also mention which software (if any) that you have used, e.g. NVivo, ATLAS.ti, MAXQDA and so on and why you chose to use these particular ones.
With regards to quantitative analysis, mention (which justification) which software you used, e.g. SPSS, MS Excel, Stata and so on. With hindsight, you will realise the importance of the chosen measurement scales in your survey questionnaire, as they are crucial for the implementation of statistical tests and advanced techniques. This is why it is important to have an idea of how you will analyse your data, prior to designing your questionnaire.
In quantitative data analysis, tests and techniques should be judiciously chosen in order to maximise the accuracy and reliability of your findings. Ensure that you check all the necessary assumptions before you use any test or apply any technique. As an example, normality testing via the Shapiro-Wilk test or the Kolmogorov-Smirnov test is essential before deciding whether to use parametric or non-parametric tests. There is a wide variety of techniques that may be used, just to name a few well-known ones:
- Descriptive analysis: charts and tables, measures of central tendency, dispersion, skewness and kurtosis, method of weighted means (including clustering), gap analysis (SERVQUAL)
- Parametric tests: paired t-test, independent-sample t-test, one-way ANOVA, two-way ANOVA
- Non-parametric tests: Chi-Squared test of independence, Mann-Whitney U test, Kruskal-Wallis H test
- Multivariate techniques: Correlation analysis, exploratory factor analysis (EFA), multiple regression analysis, logistic regression, structural equation modelling (SEM)
ETHICAL CONSIDERATIONS
According to Schindler (2019), the goal of ethics in research is to ensure that no one is harmed or suffers adverse consequences from the research activities. Therefore, you need to explain how you have adhered to ethics in your research, particularly if it includes human subjects. The usual aspects covered in this section are:
- Informed consent and right of withdrawal
- No harm to participants
- Anonymity and confidentiality
- Authorisation for data collection
- Violation of intellectual property rights (plagiarism)
REFERENCES
Bell, E., Harley, B. and Bryman, A., 2022. Business Research Methods. Oxford University Press.
Bujang, M.A., Omar, E.D. and Baharum, N.A., 2018. A review on sample size determination for Cronbach's alpha test: A simple guide for researchers. The Malaysian Journal of Medical Sciences, 25(6), pp.85-99.
Dabbagh, A., Seens, H., Fraser, J. and MacDermid, J.C., 2023. Construct validity and internal consistency of the Home and Family Work Roles Questionnaires: A cross-sectional study with exploratory factor analysis. BMC Women's Health, 23(1), pp.56-64.
Field, A., 2024. Discovering Statistics Using IBM SPSS Statistics. London: Sage Publications Ltd.
Fisher, S., 2023. Sample Size Calculator. Qualtrics. Available from: http://www.surveysystem.com/sscalc.htm
Laerd Statistics., 2018. Cronbach's Alpha (α) using SPSS Statistics. Available from: https://statistics.laerd.com/spss-tutorials/cronbachs-alpha-using-spss-statistics.php
Malhotra, N.K., 2019. Marketing research: An applied orientation. 7th ed. Upper Saddle River, NJ: Pearson/Prentice Hall.
Nawi, F.A.M., Tambi, A.M.A., Samat, M.F. and Mustapha, W.M.W., 2020. A review on the internal consistency of a scale: the empirical example of the influence of human capital investment on Malcom Baldridge quality principles in TVET institutions. Asian People Journal (APJ), 3(1), pp.19-29.
Saunders, M.N.K., Lewis, P. and Thornhill, A., 2023. Research Methods for Business Students. 9th ed. England: Pearson.
Schindler, P.S., 2019. Business Research Methods. 13th ed. New York: McGraw-Hill.
Solimun and Fernandes, A.A.R., 2017. Investigation of instrument validity: Investigate the consistency between criterion and unidimensional in instrument validity (case study in management research). International Journal of Law and Management, 59(6), pp.1203-1210.
Tavakol, M. and Wetzel, A., 2020. Factor Analysis: a means for theory and instrument development in support of construct validity. International Journal of Medical Education, 11, pp. 245-247.
Wiener, B.J., Lewis, C.C., Stanick, C., Powell, B.J., Dorsey, C.N., Clary, A.S., Boynton, M.H. and Halko, H., 2017. Psychometric assessment of three newly developed implementation outcome measures. Implementation Science, 12(1), pp.1-12.